Drift Management with Microsoft’s Unified Tenant Configuration Management (UTCM)
PART 2 OF 2
Important Note:
Results captured for this blog are from my own hands-on testing only. UTCM is in public preview with a staged rollout. Your results may differ, and things may change before becoming GA.
If you’ve come from Part 1 of this blog series, you hopefully have an insight into what configuration drift actually is and the DIY approaches available already. I first introduced the ideas for using PowerShell scripts, Power Apps, Automate flows and direct Graph API calls as alternative routes for drift management. These have been used used by many existing tools and solutions for some time now. For my own tool IntuneAutomate I also originally looked at the drift-detection functionality. It has to be said though that using what some regard as the a DIY approach like this can introduce maintenance hurdles, particularly when there’s a Microsoft upgrade, updates to an API endpoint or maybe even the renaming to a property.
That’s exactly the problem Microsoft’s Unified Tenant Configuration Management (UTCM) has been designed to solve and why getting to know the capability better became top of mind despite it still being in preview and pending license and pricing announcements.
UTCM if effectively a native, platform-level solution to the drift detection problem and includes automation built-in. When it was first announced I was immediately interested and after having had some time to try it out, I wanted to bring the details and results from my own testing into this blog. Two things were key targets for me – I wanted to identify how it works, essentially the mechanics of it and then confirm the current status or limitations to features.
The short answer by the way (as of the start April 2026) is that UTCM can work cleanly for Conditional Access (CA) and Intune resource types (RT)- Although it did take lots of trial an error to prove this with Intune RTs. In order to reach my conclusions, I spent several weeks testing across two tenants, experiencing numerous hurdles along the way. I’m talking dead ends, drained monthly quotas (on the first day of the month) incorrect UTCM API calls with mistakes from undocumented routes. This post looks to cover all of that – what UTCM is, how to deploy it, what I found, and what it means for your planning today.
| Preview Notice UTCM is still a staged public preview as of April 2026. All findings in this post reflect personal testing from my own andy@move2modern.co.uk and other commercial tenant during March–April 2026. Results will vary by tenant depending on preview ring assignment. What works or fails here may behave differently in your environment. |
| Sovereign cloud note UTCM APIs are Global service only. They are not available in US Government L4/L5 (DoD) or the China cloud operated by 21Vianet. Verify your own endpoint availability before investing time in setup. |
| Section 1 • What Is UTCM and Where Did It Come From? |
A Different Kind of Monitoring
A Different Kind of Monitoring
Part 1 of this series was about device-level drift and asking: Are my devices in the right state? Compliance, policy assignment, configuration profile application.
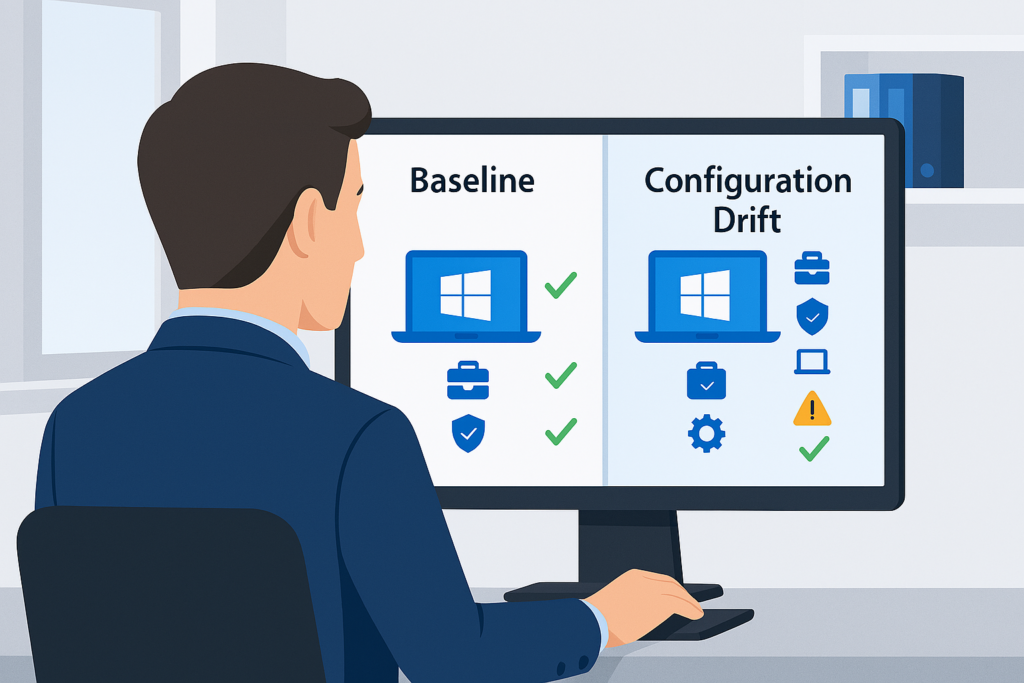
UTCM asks a different but related question: Are my Microsoft 365 tenant configurations in the right state? Not the devices. If someone quietly changes a CA policy, alters an Exchange transport rule, or deletes a compliance policy baseline from your tenant, UTCM is designed to detect that. Think of it as version control for your tenant settings, which is exactly what I needed.
The M365DSC Connection
M365DSC Led the way: Microsoft 365 Desired State Configuration (M365DSC), an open-source PowerShell project that has existed since 2019, led the way for this concept covering the M365 ecosystem. UTCM will effectively be Microsoft’s officially-supported, Graph API-native successor to this, where solutions shift from PowerShell DSC modules to JSON baselines and REST endpoints. Key to note here is that Nik Charlebois, the Principal Program Manager behind UTCM, was also the original creator of M365DSC making it clear that UTCM is the evolution of that work into the product platform.
The Three Core Concepts
| What It Does | Key Constraint |
| Point-in-time capture of current tenant configuration for one or more resource types. This becomes your baseline. | Expires after 7 days – Recommended to export locally immediately. |
| Runs every 6 hours and compares live tenants against your stored snapshot baseline. | 6-hour interval is fixed and not configurable in preview. |
| When live state differs from baseline, a drift event is created with the old value, new value, and resource details. | No automated remediation in preview – just detection only at this stage. |
Where UTCM Lives in Microsoft’s Stack
UTCM capabilities are exposed through Microsoft Graph (beta endpoint currently, with some core endpoints also available at v1.0). Microsoft Entra Tenant Governance also has a new UI feature in preview available in the Entra admin centre. Thiis provides capability for viewing permissions and monitors with run history, and drift results without any API calls. There is no equivalent UI at this point though in the Intune admin centre:
Tenant Governance → Configuration management
REALLY key to note here is that UTCM is not an Intune only feature. In preview, UTCM is designed to cover six Microsoft 365 workloads, although coverage and maturity does vary by workload, at least with my own testing:
- Entra ID – Conditional Access policies (CA), authentication methods, named locations, and more
- Intune – compliance policies, app protection, assignment filters, and more
- Exchange Online – accepted domains, transport rules, anti-phish policies, and more
- Microsoft Teams – calling policies, channel settings, app permissions
- Microsoft Defender – alert policies and related settings
- Microsoft Purview – compliance and information protection settings
You can find the Microsoft official overview here:
For my own testing, this post focuses on just two of the areas, CA and Intune RTs, but I’m sure I’ll expand out over time with more. Good to know off the bat is that CA works cleanly end-to-end. For Intune resource types however, the picture is more complex. Read on to see exactly what this means. The rest of the blog walks you through the necessary background to UTCM then follows a logical route to set it up and test, together with tips and key findings along the way.
| Section 2 — How to Deploy UTCM |
Prerequisites
- PowerShell 7.2 or later
- Microsoft.Graph.Authentication module – Install-Module Microsoft.Graph.Authentication -Scope CurrentUser
- An account with Global Administrator or Privileged Role Administrator in the target tenant
- The ConfigurationMonitoring.ReadWrite.All Graph scope (delegated, not application – see Section 7)
The UTCM Service Principal
First off, UTCM uses a dedicated service principal (SP) to read all the resources it monitors. This means before any snapshots or monitors can be created, your SP must exist in your tenant and with the correct permissions setup. There are two SPs to provision:
| Service Principal | App ID | Purpose |
| Unified Tenant Configuration Management | 03b07b79-c5bc-4b5e-9bfa-13acf4a99998 | The UTCM SP – does the actual monitoring work and is installed with a script or manually in Azure |
| M365 Admin Services | 6b91db1b-f05b-405a-a0b2-e3f60b28d645 | Required by Microsoft as a co-dependency – ensure the M365 Admin Services SP is provisioned in the tenant, should be provisioned automatically as part of M365 service activation but worth checking. |
I produced and fine tuned Script 1 below to handle the provisioning for the UTCM SP, checking whether it already exists before attempting the setup.
The Five-Script Pipeline
Following a logical setup for UTCM I’ve created and make available for you 5 PowerShell scripts to run.
| Script | What It Does | When to Run |
| Script 1 | UTCM Inventory PowerShell script. Checks what you have setup already for UTCM with an option to delete existing Snapshots and Monitors as needed. | First script to run. Run as many times as needed to check on status of UTCM |
| Script 2 | Checks for and creates the UTCM and M365 Service principal (SP) as required | One time at initial setup if required – Optional – see results from script 1 above |
| Script 3 | Grant permissions for enabled resource types only. Enabled for CA and Intune resource types only. Add to this as required for more | One time, or again when enabling new RTs |
| Script 4 | Create snapshot jobs, poll for completion, save JSON baselines locally | Each time you want a new baseline |
| Script 5 | Create monitors, reading from the snapshot index created by Script 3 | After Script 4 completes |
| Script 6 | Query drift results for all active monitors, generate per-RT drift-check scripts | On a schedule for ongoing monitoring |
| Scripts available on GitHub All above scripts are available for download on the Move2Modern GitHub site – https://github.com/Croxleyboy/IntuneScripts/tree/master/UTCM%20-%20Drift%20Monitoring |
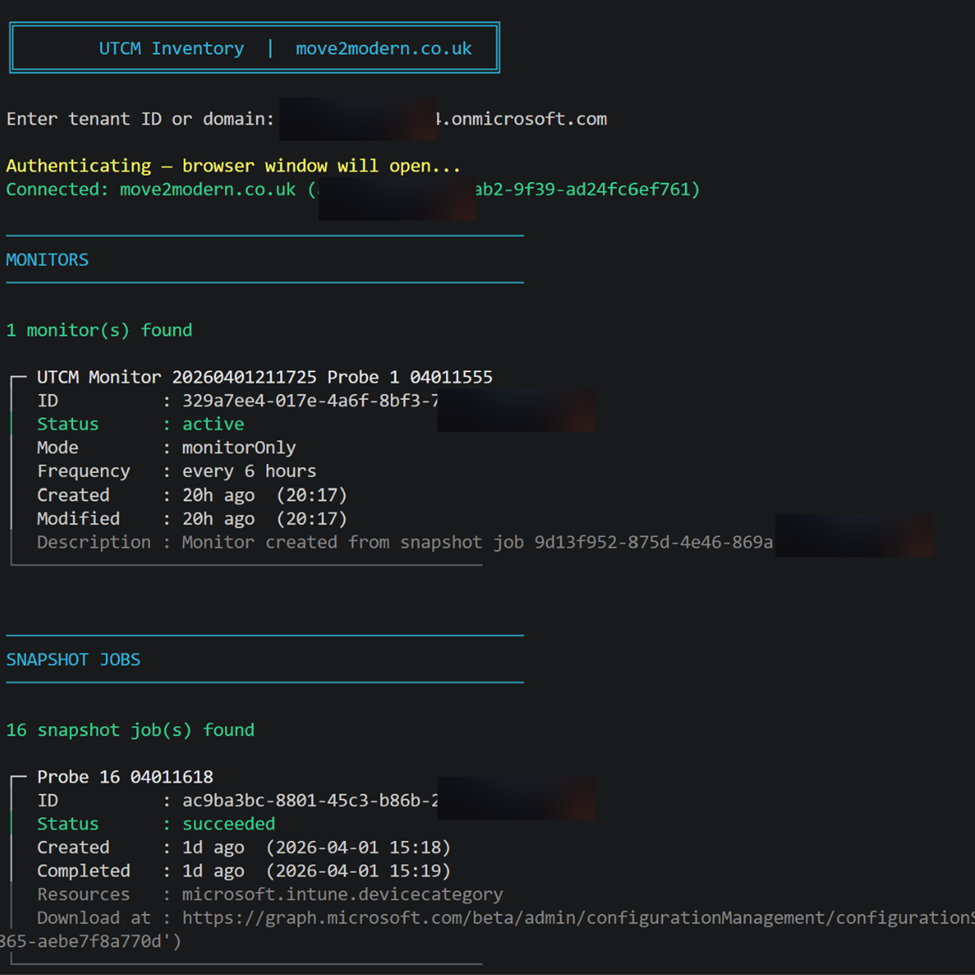
Script 1 — UTCM Inventory
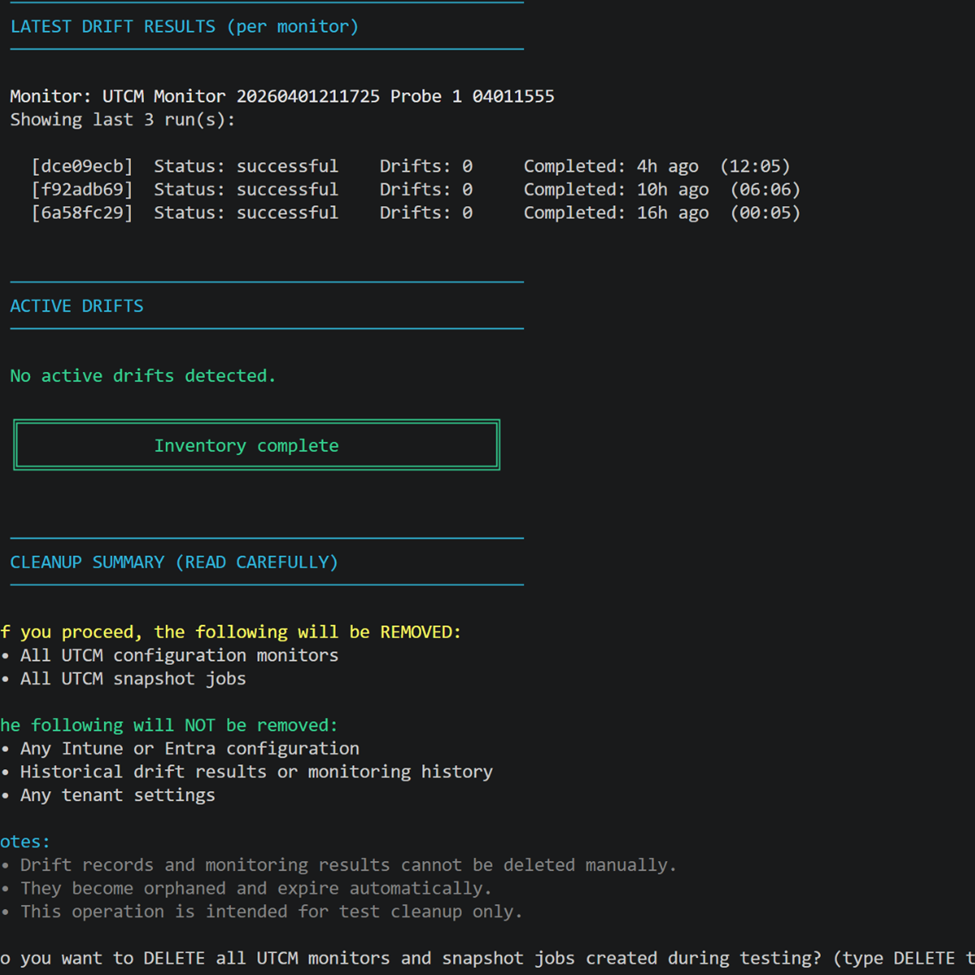
This is the first script to run as it lists all UTCM monitors, snapshot jobs, and latest drift results for a target Microsoft 365 tenant. It first asks for your tenant ID or domain to authenticate before progressing. The good thing here is at the end of the discovery it provides you with the option to delete all snapshots and monitors. If you’re running this for testing initially then I recommend this. The added benefit is you can always run this again at any point to check on the status.
Script 2 — Setup Service Principals
This step is probably the most straight forward and contains the easiest PowerShell steps. I say this as UTCM uses a fixed App Id for both SPs. The two are for UTCM and M365 although it is unlikely you will need to setup M365 as it is generally configured as part of your M365 onboarding. The script will check for the creation of these and if absent goes ahead and creates them.

Fixed Microsoft app IDs (do not change)
UTCM AppId = ’03b07b79-c5bc-4b5e-9bfa-13acf4a99998′
M365 AdminSPId = ‘6b91db1b-f05b-405a-a0b2-e3f60b28d645’
Script 3 — Grant Permissions
The permissions scripts is clean and simple – It runs a check for the required permissions to see if they already exist in your tenant for both CA and Intune resource types – then creates them if not present. Naturally any additional resource types will need to be setup manually using a script or using the new Tenant Governance settings within Entra.Microsoft.com – recently added UI (in preview).
Find script 3 here: https://github.com/Croxleyboy/IntuneScripts/blob/master/UTCM%20-%20Drift%20Monitoring/3%20-%20Grant%20permissions%20for%20CA%20and%20Intune%20resource%20Types.ps1
If and when the permissions have been configured, you will get confirmation of this using the script.
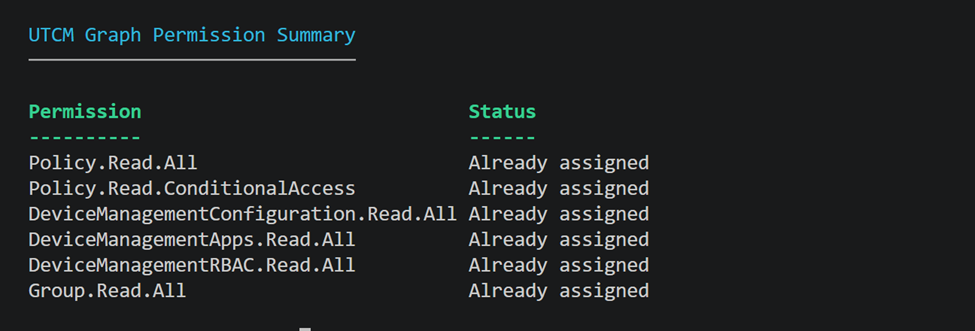
Permissions Required
| Permission | Required for | Granted on |
| Policy.Read.All | Reading CA policies for snapshot capture | Microsoft Graph SP |
| Policy.Read.ConditionalAccess | CA policy monitoring (both are needed – neither alone is sufficient) | Microsoft Graph SP |
| ConfigurationMonitoring.ReadWrite.All | Creating and managing snapshots and monitors | Microsoft Graph SP – confirmed required in testing |
| ConfigurationMonitoring.Read.All | Unlocks additional Entra resource types (authenticationStrengthPolicy, authorizationPolicy, crossTenantAccessPolicy) | Microsoft Graph SP – confirmed required in testing |
| Application.ReadWrite.All | Creating the UTCM SP (admin running setup only) | Delegated at consent |
| AppRoleAssignment.ReadWrite.All | Granting permissions to the UTCM SP (admin running setup only) | Delegated at consent |
| DeviceManagementConfiguration.Read.All | Intune configuration policies (backend pending activation) | Microsoft Graph SP |
| DeviceManagementApps.Read.All | Intune app management (backend pending activation) | Microsoft Graph SP |
| DeviceManagementRBAC.Read.All | Intune role definitions (backend pending activation) | Microsoft Graph SP |
| DeviceManagementManagedDevices.Read.All | Intune managed devices (backend pending activation) | Microsoft Graph SP |
| DeviceManagementServiceConfig.Read.All | Intune service configuration (backend pending activation) | Microsoft Graph SP |
| Both CA permissions are required |
| Policy.Read.ConditionalAccess alone is not sufficient. Policy.Read.All must also be granted to the UTCM SP. This is not clearly documented — I confirmed it through testing. |
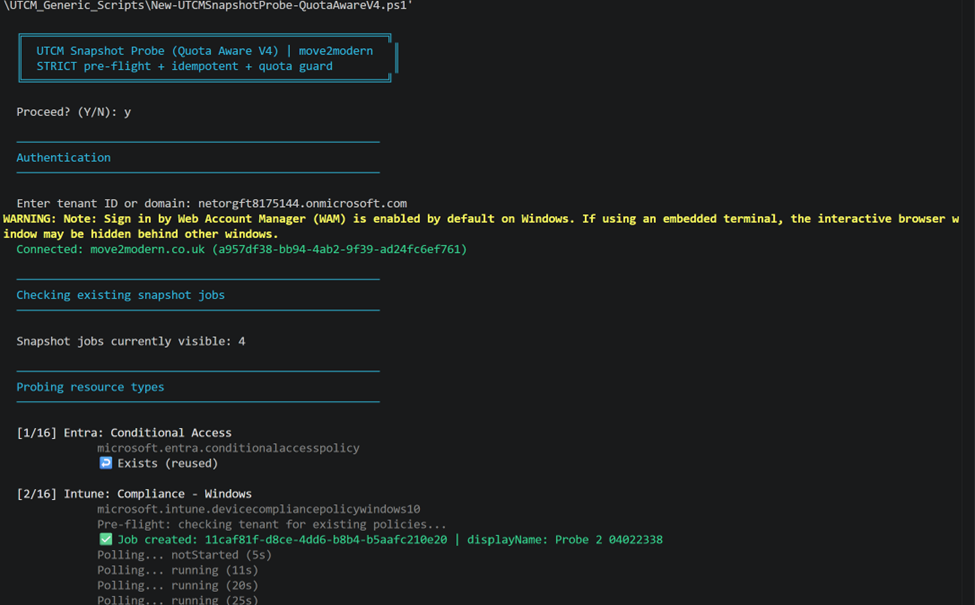
Script 4 – Create Snapshots
The creation of snapshots is the next step in the logical order or things. We can do this using the included script 4 added to the Github site. The thing to note here is that because:
- There’s a 20,000 resources per tenant per month
- Snapshots are retained only ~7 days
- Excess probing can block legitimate use
The script first checks if a snapshot exists and only proceeds per Resource type if not. It will also poll for completion and saves the snapshot JSON to .\out\snapshots\. Ensuring you have a copy. UTCM is not intended for long-term storage of configurations. An important architectural decision was made by Microsoft in that, the next logical step is to create a Monitor from the created snapshot. BUT once the monitor baseline JSON has been captured and embedded within each monitor, the originating snapshot has done its job and you no longer need it. So, the deletion is just Microsoft’s way of keeping the platform clean and within limits.
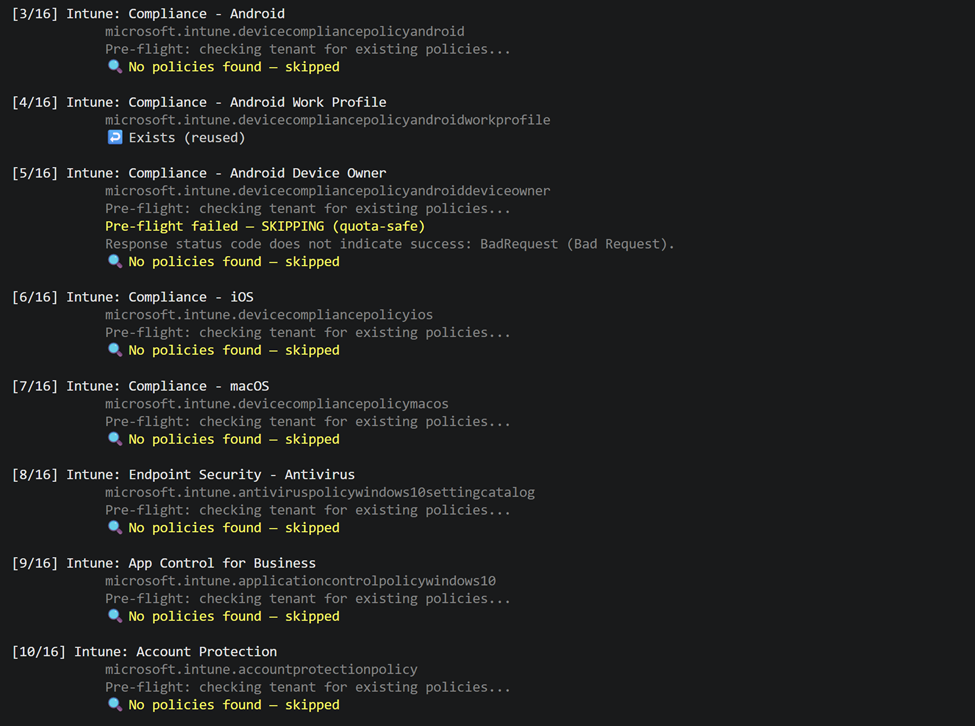
Test discoveries: To hep you navigate the snapshot stage, as a result of my own testing I eventually came to the conclusion that I needed to put a check into this script to test if there were any existing and related policies available in the tenant before creating a snapshot. This is because a snapshot would complete successfully even with no policies in the tenant, MEANING the corresponding Monitor script would fail to create when using an empty resource JSON from the corresponding snapshot.
Important notes:
- Creating a snapshot is optional. As the monitor baseline (see below) and the displayName are the only required properties when creating a new monitor. The baseline is essentially just a JSON blob which can also be hand-crafted and used by a monitor without ever running a snapshot job. HOWEVER The snapshot is just the easiest and most reliable way to generate that JSON, as it captures the real structure and property names that UTCM expects.
- DisplayName must be letters, numbers and spaces only – no hyphens, dots or underscores
- DisplayName must be between 8–32 characters. ‘CA Baseline 20260401’ works; ‘CA-Baseline_01’ does not
- Snapshots have a 7 day expiry – so having a local JSON copy is optional but recommended for application uses.
- Snapshot jobs are asynchronous. They poll every 5–15 seconds until status is succeeded, partiallySuccessful, or failed (You should see this when the script runs)
- When attempting to test for available policies per resource type the graph calls may need to use the beta rather than v1.0 path and this will be changing over time meaning the script will need updating.
Download script 4 here: https://github.com/Croxleyboy/IntuneScripts/blob/master/UTCM%20-%20Drift%20Monitoring/4%20-%20New-UTCMSnapshotProbe-QuotaAwareV4.ps1
Script 5 — Create Monitors
So, you have your Snapshots the next step here is setup Monitors – The key purpose of this step and associated script is to first discover if a monitor already exists for your resource types and attempt to create new monitors using the resources identified and saved as JSON with the snapshot. As mentioned previously taking this approach is optional but that’s the way the script has been developed here for convenience. The key to this is again down to save quota’s and secondly to ensure one exists to help maintain control on what’s running. Multiple monitors are also possible for the same resource type as shown below in Entra but not recommended for the same resource type. For this reason, the script avoids setting up more than one monitor per resource type. If by chance this happens rather than scripting this, you can access:
Entra.Microsoft.com > Tenant Governance > Monitors
and delete the monitor no longer required.
From my own testing this step is really what caused the greatest pain navigating the various scenarios. If as mentioned with script ‘4 – Snapshots’, a snapshot for a given resource type utilises the snapshot for its JSON definition BUT the baseline contains an empty resources as shown below, this would make the monitor useless as it would be monitoring a policy that doesn’t exist. This is exactly what happened for me. Worse still it was the reason why trying to create some of my Intune resource type monitors initially failed. This is a strong message in relation to the current status – It means a ‘succeeded’ snapshot is not the same as a usable snapshot by a monitor creation. As a consequence of the considerable debugging time spent on this, I therefore built into the monitor script a check to see if the snapshot JSON is empty before trying to proceed. (see Section 4 — My Journey).
Example of empty Resources:
{
“description”: “UTCM resource type probe 4 of 16: microsoft.intune.devicecompliancepolicyandroidworkprofile | move2modern.co.uk”,
“resources”: [],
“parameters”: [],
“id”: “194582d3-22d6-494f-b1f6-f7e027707ced”,
“@odata.context”: “https://graph.microsoft.com/beta/$metadata#admin/configurationManagement/configurationSnapshots/$entity”,
“displayName”: “Probe 4 04011559”
}
Find the PowerShell script here: https://github.com/Croxleyboy/IntuneScripts/blob/master/UTCM%20-%20Drift%20Monitoring/5%20-%20New-UTCMAllMonitorSetup.ps1
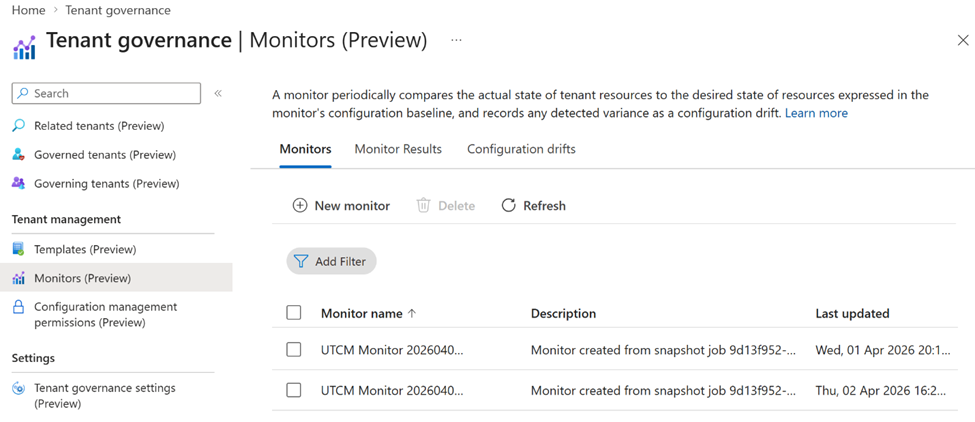
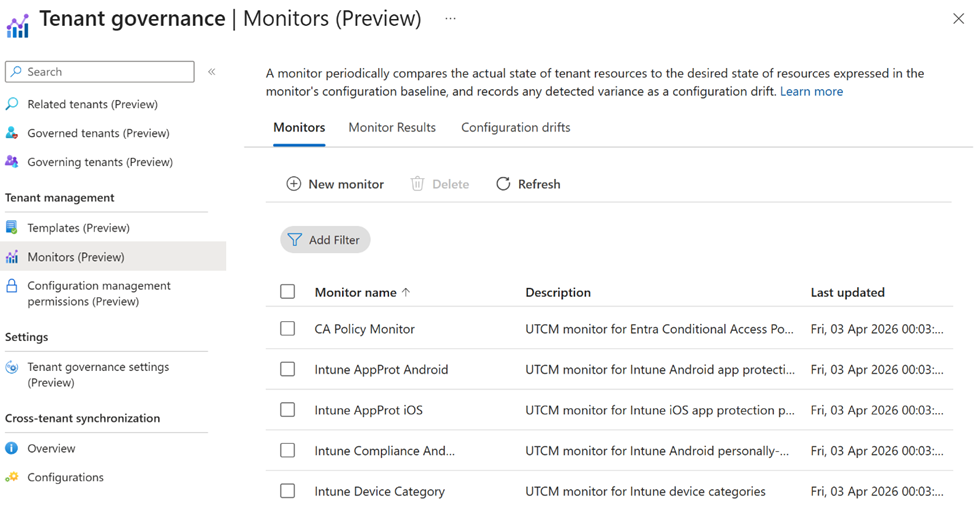
Added benefit: When complete you will see the different monitors appear in Tenant Governance.
And over time you’ll see the results of the monitors be populated.
Script 5 — Collect Drift Results
The first thing to add here is that the easy route to view the collected data is through the tenant governance portal UI:
Entra.microsoft.com > Tenant Governance (Preview) > Monitors (Preview) > Monitor results & Configuration drifts
Both of the available tabs will deliver updates and changes to the policies over time too.
Drifts Report script: https://github.com/Croxleyboy/IntuneScripts/blob/master/UTCM%20-%20Drift%20Monitoring/6%20-%20Get-UTCMDriftReport.ps1
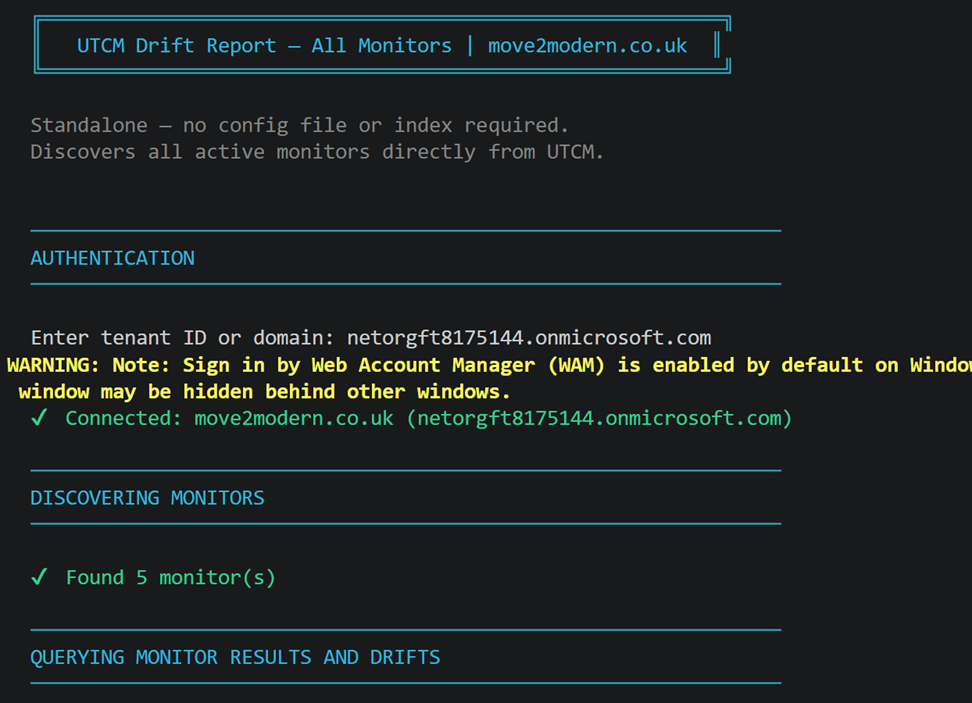
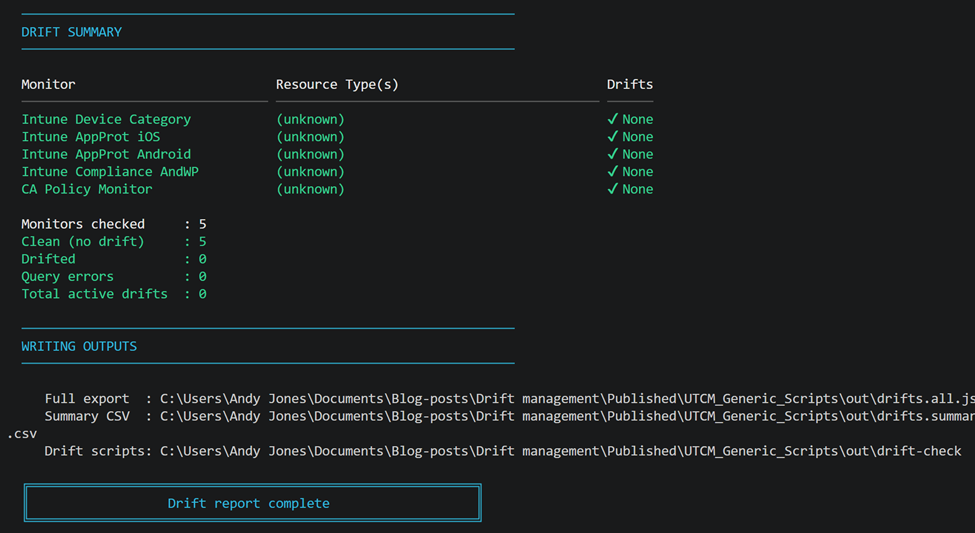
The other way to check in on your running monitors and maybe for you to use for your apps is to run a PowerShell script which:
- Connects to the tenant and discovers all active UTCM monitors directly from the API
- For all your running monitors discovered, the last run result is queried along with all active configuration drifts – extracting the resource type from the monitor’s embedded baseline JSON
- It prints a live per-monitor status to the console as it runs and produces a formatted summary table showing a drift count per monitor
- Finally it writes a full JSON export (drifts.all.json) and a timestamped CSV summary locally to .\out\
| Section 3 — Test Results: April 2026 |
Testing Setup
All tests were run against my move2modern.co.uk tenant during March 2026 and on 1 April after the monthly snapshot quota had been reset. I used two purpose-built scripts: a snapshot probe script that submits one snapshot job per resource type and polls for completion, and an inventory script that lists existing monitors, snapshot jobs, and drift results. Both are available on GitHub.
The testing approach was deliberately systematic: fix the display name format, run all 16 resource types in a single pass, and let the results speak for themselves with no manual retry, no cherry-picking.
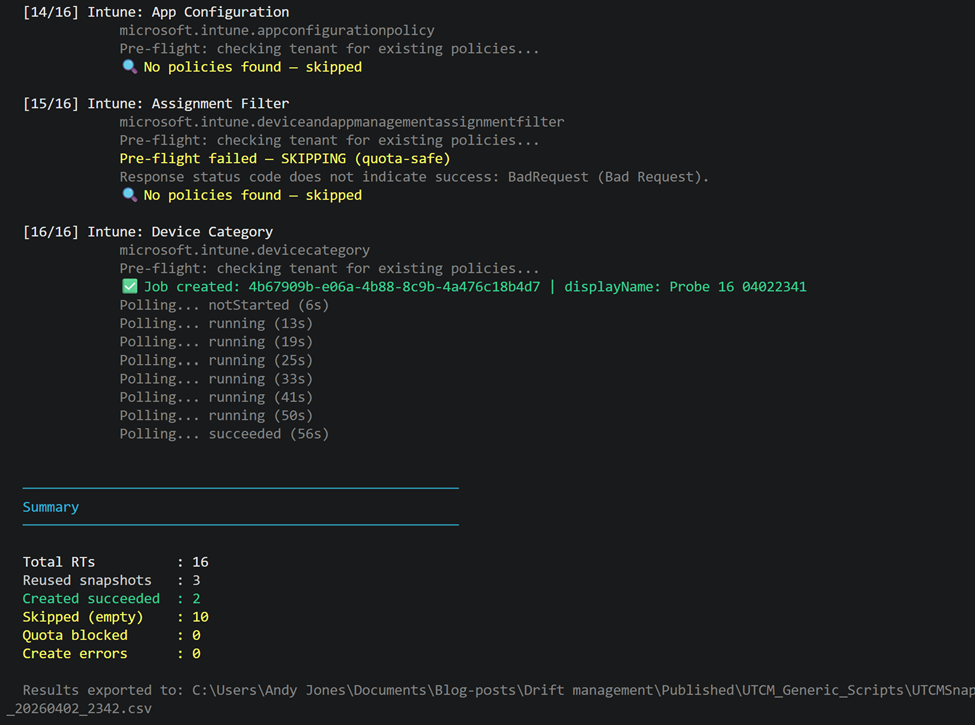
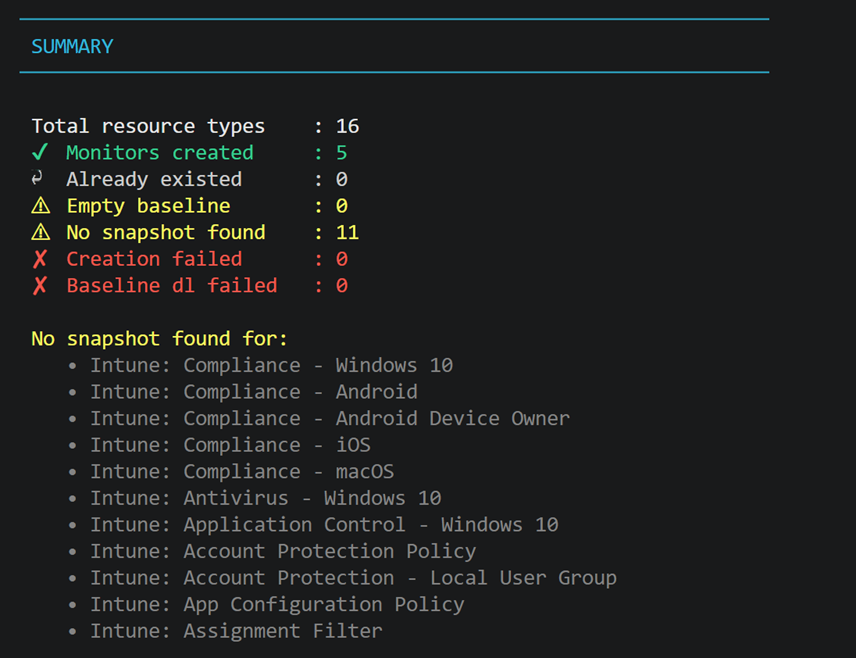
Snapshot Results – 14 of 16 Succeeded
After fixing the display name validation issue (see Section 4), the snapshot probe returned the following:
| Notes on the two non-successes Conditional Access: the job returned partiallySuccessful (not failed) and a valid snapshot URL was generated. The timeout was a script poll timeout, not an API failure. The CA snapshot and monitor were created successfully via a separate run. |
| For devicecompliancepolicywindows10: the job was accepted, ran for 61 seconds, and returned failed with no error detail. No diagnostic information was surfaced by the API. All other Windows 10 compliance variants (Android, iOS, macOS) succeeded – this one failed silently for this specific type. |
Monitor Results – CA Works, Intune came through eventually
Snapshot success turned out to be only half the story. When I attempted to use the Intune snapshot JSON files as baselines for monitor creation, every Intune type failed at first, but in a very specific and informative way as per below.
Testing with microsoft.intune.devicecompliancepolicyandroidworkprofile as a representative case revealed the root cause:
| CA (conditionalaccesspolicy) | Intune (devicecompliancepolicyandroidworkprofile) |
| ✅ Accepted and completes | ✅ Accepted and completes |
| ✅ resourceLocation returns baseline JSON | ✅ resourceLocation returns JSON |
| ✅ Yes — resources array present with properties | ❌ No — resources[] array is absent from the JSON |
| ✅ Succeeds — baseline is valid | ❌ Fails — baseline not valid for monitor use |
| ✅ Live — 1 drift detected in testing | ❌ Not possible without a valid monitor |
| The critical distinction: export vs baseline |
| Early testing showed cases where snapshot jobs completed successfully but produced baseline JSON with an empty resources[] array. In those cases, monitor creation either failed or resulted in a monitor that was effectively monitoring “nothing”. In later testing, that behaviour changed. Intune monitors were successfully created and drift evaluation ran end-to-end. However, execution metadata was inconsistent: some monitors reported the resource type as “(unknown)”, and querying monitoring results sometimes returned BadRequest even though drift checks completed successfully. The most accurate description as of April 2026 is that Intune monitoring works, but parts of the execution and reporting pipeline are still maturing. Snapshot success alone isn’t sufficient – A usable baseline must contain populated resources, and scripts should validate this before monitor creation. In my testing, “(unknown)” didn’t stop drift evaluation; it appears to be a reporting/telemetry issue rather than a functional failure. |
What This Means in Practice
Multiple test cases revealed a number of results as shown below which through understanding the mechanics and what some may regard as the minor limitations OR maybe just the way UTCM operates allowed me to navigate the process we will ultimately see working.
| Status (April 2026) | Notes |
| ✅ Working | Confirmed in both tenants |
| ✅ Working | Runs every 6 hours, drift detected in testing |
| ✅ Working | 1 drift found in testing – correct delta captured |
| ✅ Working | 16/16 types succeeded – export format only |
| ❌ Blocked | Baseline missing resources[] – cannot create monitor |
| ❌ Not available | No monitor possible without valid baseline |
| ❌ Failed | Silent failure – no error detail from API |
| Section 4 — My Testing Journey: What I Got Wrong and Why It Matters |
Getting to the clean results took several weeks and several wrong turns. So by documenting them here they may be genuinely useful for you approaching UTCM for the first time. It’s clear the traps are not obvious when building this for yourself even when using the Microsoft documentation.
Wrong API Endpoint Path
In my early scripts, I was calling the wrong UTCM API path. The correct endpoint is:
I’d mistakenly used configurationMonitoring instead of configurationManagement, and monitors instead of configurationMonitors. Either mistake on its own was enough to break the request, and together they resulted in repeated 400 BadRequest responses.
What made this particularly frustrating is that the error message – “Resource not found for the segment” – doesn’t tell you which part of the path is wrong, so it wasn’t immediately obvious whether the issue was the workload, the resource name, or the base path itself. That lack of precision is what turned a simple typo into a much longer debugging exercise than it should have been.
Snapshot Job ID vs Snapshot Reference
When creating a monitor, the baseline must reference a configuration snapshot albeit from the captured snapshot as per my scripts or via a JSON created manually – the downloaded JSON PLUS be aware not to use the snapshot job ID. I initially assumed the monitor creation call would take the job ID and retrieve the snapshot itself. BUT It doesn’t. The workflow is:
- Create snapshot job – get job ID
- Poll job until completed – get resourceLocation URL
- Fetch the actual snapshot JSON from resourceLocation
- Pass that JSON as the baseline body to POST /configurationMonitors
Passing a job ID to the monitor creation endpoint returns a validation error that looks like a permission or schema error rather than a ‘wrong input type’ error. This wasted several debugging sessions.
Display Name Validation — Undocumented Rules
My probe script was generating display names like ‘Probe microsoft.entra.conditionalaccesspolicy 20260401 1250’. Every single request returned 400. The error body, once I surfaced it properly, revealed two validation rules that are not documented in the Microsoft UTCM documentation at the time of writing:
- Display names must contain only alphabetic characters, numbers and spaces — no dots, hyphens, underscores or any other special characters
- Display names must be between 8 and 32 characters
The fix was simple once identified – generate names like ‘Probe 1 04011250’ – but diagnosing it required surfacing the raw Graph API response body, which the PowerShell exception message obscures. The fix is included in all scripts published on GitHub.
| What the error actually says |
| “The field DisplayName must be a string with a minimum length of 8 and a maximum length of 32.” |
| “Snapshot Job displayName contains invalid characters. Only alphabets, numbers, and spaces are allowed.” |
| Both messages appear in the error details array within the 400 response body, not in the top-level exception message. |
Wrong Resource Type Strings
In my early testing I used shortened, Graph API-style resource type strings derived from my knowledge of the standard Intune Graph API – things like microsoft.intune.configurationpolicy and microsoft.intune.compliancepolicy. These all returned 400 validation errors, which I initially interpreted as those types not being supported currently.
The actual issue was that the UTCM resource type naming convention is different to the standard Graph API naming convention. The official UTCM Intune resource catalog at learn.microsoft.com/en-us/graph/utcm-intune-resources uses fully-qualified, platform-specific type names such as:
- microsoft.intune.devicecompliancepolicyandroidworkprofile (not microsoft.intune.compliancepolicy)
- microsoft.intune.antiviruspolicywindows10settingcatalog (not microsoft.intune.antiviruspolicy)
- microsoft.intune.attacksurfacereductionrulespolicywindows10configmanager (note the configmanager suffix – this is the ConfigMgr co-managed variant)
The last one is particularly worth noting. The resource type attacksurfacereductionrulespolicywindows10configmanager was explicitly confirmed as not supported by the API – The correct naming, genuinely unsupported type: devicecleanuprule has the same status – listed in the docs but rejected at runtime as ‘not supported’. These are two where the documentation is ahead of the API implementation.
The key lesson here: always use the official UTCM catalog as your source for resource type strings, not the Graph API reference.
Quota Exhaustion — First Day of the Month Problem
UTCM has a quota of 20,000 resources per tenant per month at the time of testing. In my initial probe sessions I was submitting 30+ snapshot jobs to test which resource types worked, and those jobs, even when they returned empty results, consumed quota. I unfortunately exhausted the monthly quota on the first day by running systematic tests, which blocked all subsequent CA baseline operations for the rest of the month. Important to know right, although polling, listing, and reading existing jobs can be done all day long and these have zero quota impact. Only creation counts towards the quota. NOTE: The API does not surface a quota error when this happens. A snapshot job that hits quota exhaustion is accepted, runs, and returns partiallySuccessful or succeeded with zero resources. There is no indication that quota was the cause. The quota resets on the first of each month, which is why I was able to run the clean April results above.
| Protect your quota Run probe and test scripts against a secondary or test tenant where possible. If you see snapshot jobs returning 0 resources for types that should have data, quota exhaustion is the most likely cause. Production baseline operations should be prioritised. Guide: A CA snapshot of a tenant with 20 CA policies consumes 20 of the 20,000 monthly resource quota. |
The Wrong Drift Endpoint
Some community examples reference a driftRecords subresource under configurationMonitors. In testing, GET /configurationMonitors/{id}/driftRecords returns 400. BUT the correct endpoint for querying drift is configurationDrifts filtered by monitorId:
| GET $BaseUri/configurationDrifts?`$filter=monitorId eq ‘{your-monitor-id}’ |
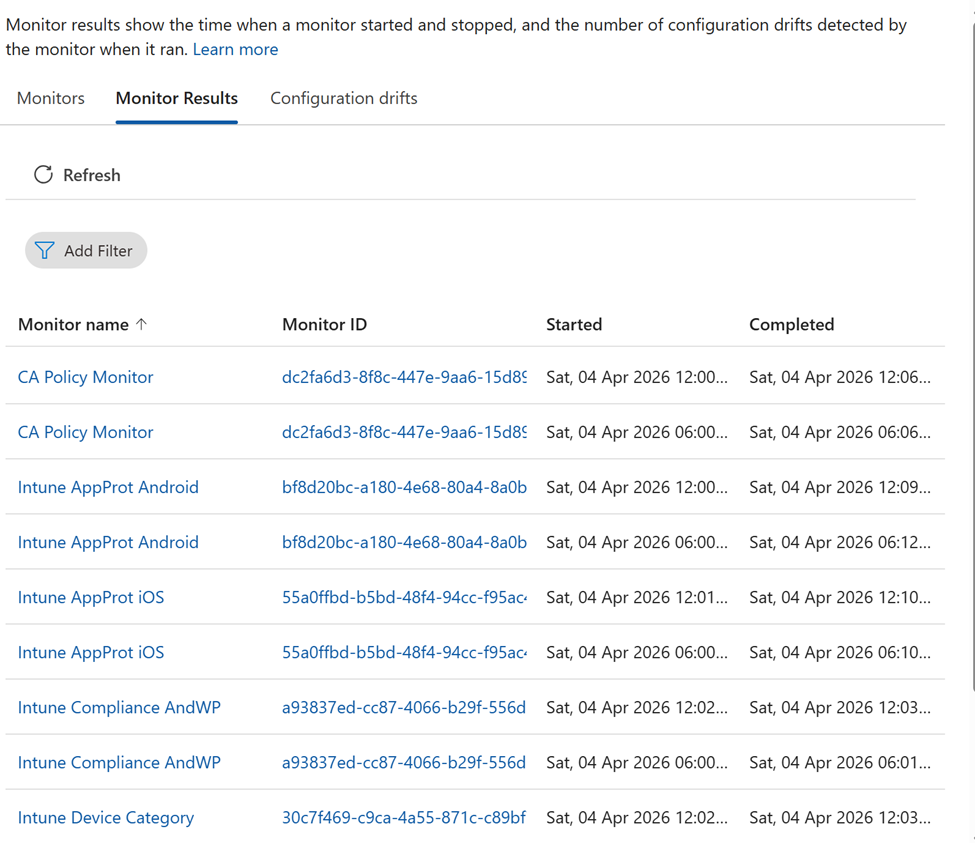
Similarly, configurationMonitoringResults is a useful endpoint that surfaces per-run history including timestamps, status, and drift counts per run. This will be useful for confirming the monitor is actually executing, independent of any drift records.
| Section 5 – The Entra Tenant Governance UI |
When It Arrived
The Good News is the Entra admin centre preview UI for UTCM has now arrived as part of the Microsoft Entra Tenant Governance preview- in January 2026. The configuration management section can be found under:
- Tenant Governance → Configuration management (Preview)
- Configuration Management → Monitors (Preview).
Both are now added in the Entra admin centre menu options.
What the UI Provides
It’s important to be clear here. The portal is split into three straightforward views:
- Monitors – Where you can see what’s being monitored, when it last ran, and create or delete monitors.
- Monitor results – Provides a run‑by‑run view showing execution times, status, and drift counts.
- Configuration drifts – Includes a single list of everything that’s drifted, including what changed and when it was first detected.
When creating a new monitor, the wizard first shows the permissions currently assigned to the UTCM service principal as a quick sanity check, and then lets you upload a JSON baseline directly. That means you can bypass the snapshot‑to‑baseline issues covered earlier and you provide the JSON and the UI handles the rest.
Where PowerShell or Graph is still needed
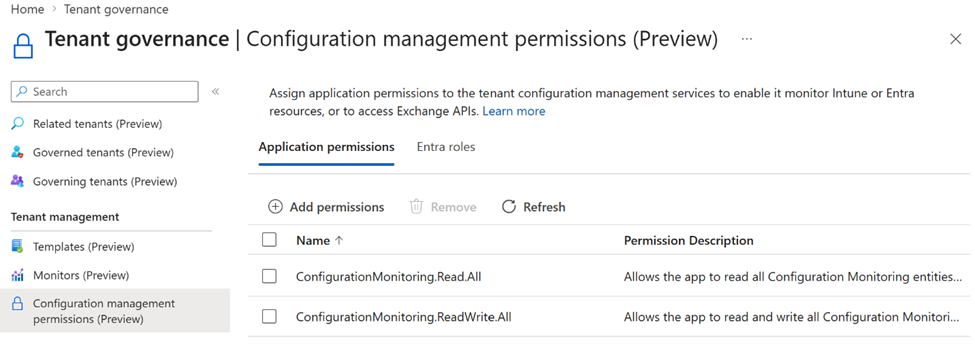
The UI can now cover most of your day‑to‑day UTCM tasks, but setup still involves two permission layers:
- The UTCM service principal permissions define what the monitors can read (for example, Conditional Access and Intune). These are visible and manageable in the Entra UI.
- Calling user or app permissions define who can create and manage snapshots and monitors. So permissions like ConfigurationMonitoring.ReadWrite.All will still need to be manually granted to your admin user or app registration.
The result, setup still comes down to two steps:
- Use the Entra UI to assign workload permissions to the UTCM service principal.
- Grant ConfigurationMonitoring.ReadWrite.All (and related permissions) to the user or app managing UTCM.
Overall, yes UTCM is now much easier to work with. Permissions are now clearer, monitor creation is simpler, and baseline management is far more approachable. The scripts in this post are still useful for automation and scale, but for a single‑tenant setup or first evaluation, the UI alone is now a solid starting point.
A few current UI limitations to be aware of
- Snapshot jobs are still created and managed via Graph, which makes scripting the most reliable option when working at scale.
- There’s no Intune‑specific UTCM UI in the Intune admin centre and all Intune monitoring flows through Tenant Governance.
- When monitor creation fails, detailed error information is only available via the API.
- Snapshot job history isn’t currently surfaced in the UI; the portal focuses on monitors and drift results rather than the underlying snapshot operations.
These are all preview‑stage gaps rather than hard limitations, but they’re worth knowing if you’re troubleshooting or automating UTCM today.
| Section 6 – Where Do Third-Party Tools Stand |
A reasonable question to throw into the ring here is how do third‑party tools achieve comprehensive Intune drift detection, especially given the current preview limitations of UTCM.
In practice, most established tools are not built around UTCM. They predate it entirely and work directly against the standard Intune Graph API endpoints. This reflects the same approach described in Part 1 of this series. Those APIs have been stable and production‑ready for years, which is why these tools already offer deep and reliable Intune coverage.
Where tools have started to adopt UTCM though, they’re effectively wrapping the same APIs used in my scripts above so I’m talking configurationMonitors, snapshot creation, and configurationDrifts. As a result, for sure they have encounter the same structural constraints and validation rules. These are enforced server‑side, which means client code can’t work around them.
The TenantBaseline project as an example by Ugur Koc (Microsoft MVP) is a good example. Its changelog documents a real‑world BadRequest issue caused by submitting the IsSingleInstance property for Intune resource types. It shows history where something the UTCM API explicitly rejects because Intune policies are non‑singleton. That’s a Layer‑1 validation failure, and it’s the same class of issue I ran into during my own testing.
The takeaway is that UTCM doesn’t magically unlock new Intune capabilities for third‑party tools yet. Where UTCM works, it works the same way for everyone. Where it’s limited, those limits apply equally. This happens whether you’re using your own scripts or a packaged tool.
| Section 7 – Current Limitations and Preview Gotchas |
One thing that caught me out during testing is that UTCM doesn’t yet behave reliably with app‑only authentication for write actions.
When I tried creating snapshots and monitors using a Managed Identity (application‑only token), the calls consistently came back with 403 Forbidden, even though ConfigurationMonitoring.ReadWrite.All was correctly assigned. Interestingly, read‑only actions worked just fine. I could list snapshot jobs and download baselines without any issues. It was only the write operations that were blocked.
In practical terms, this means you can’t fully automate UTCM end‑to‑end today. Detection, reporting, and things like SharePoint or Power Automate workflows can all run unattended. But when it comes to resetting or creating a baseline, you still do need an interactive sign‑in, so someone logged as an Intune Administrator or Global Administrator permissions.
It’s not a big task, but it is manual. If you’re aiming for fully automated drift remediation, this is one of the current preview limitations you’ll need to design around. From what I can see, this looks like a preview‑stage constraint, not a confirmed long‑term design decision.
| Conflict with Microsoft documentation |
| Microsoft’s published authentication documentation states that application permissions are supported for snapshot and monitor creation. My experience contradicts this. This may reflect a preview ring behaviour, a missing prerequisite, or a temporary limitation. If you test application-only auth and find it working, please share your results – that would help confirm whether this was specific to my setup or a general preview constraint. |
No Automated Remediation in Preview
UTCM in preview mode is detection-only. When a drift is detected, resolution still requires manual action using the relevant admin tool. Microsoft has however signalled automated remediation (write-back) on the roadmap for post-GA, but it is not available today.
UTCM Is Not a Replacement for Device-Level Monitoring
| Important architectural distinction |
| UTCM answers: has this Conditional Access policy or compliance policy baseline changed from its baseline definition? |
| Device compliance monitoring answers: is this specific device compliant right now? |
| These are different questions at different layers. UTCM does not replace device compliance monitoring and is not designed to. You need both. Even when UTCM reaches full Intune coverage, Part 1 device-level monitoring remains necessary. |
Quota Reference
| Limit | Value | Notes |
| Max snapshot resources per month | 20,000 across all jobs | Resets 1st of each month — not surfaced when exhausted |
| Max monitors per tenant | 30 | Across all resource types |
| Monitor run frequency | Every 6 hours | Fixed — not configurable in preview |
| Daily resource quota | 800 resources/day across all monitors | Each monitor run × resource count consumes quota |
| Snapshot expiry | 7 days | Export locally immediately — resourceLocation returns 404 after expiry |
| Max visible snapshot jobs | 12 per docs — higher in practice | My tenant showed 18+ during testing |
Licensing
UTCM Graph API access is available during preview. GA licensing is not yet confirmed at the time of writing (April 2026). The expected landing place could be Intune Plan 2 or the Intune Suite add-on for full governance features, but there are no formal announcements. Refer to Microsoft’s Tenant Governance licensing documentation at the time you evaluate for the latest position.
| Section 8 — Summary: Part 1 vs Part 2 — Which Approach When? |
Both approaches are valid today and serve different purposes. This comparison is based on the state of both the DIY Graph API approach and UTCM as of April 2026.
| Requirement | Part 1 – DIY (Graph API / Custom tooling) | Part 2 – UTCM (Preview – current reality) |
| Conditional Access policy drift detection | ✅ Possible, but requires custom logic and ongoing maintenance | ✅ Fully working end‑to‑end (snapshots, monitors, drifts confirmed) |
| Configuration snapshot / baseline creation | ✅ Graph API — stable, production‑ready | ✅ Snapshots confirmed across CA and multiple Intune workloads |
| Intune configuration policy monitoring | ✅ Fully achievable via Graph | ✅ Monitors and drift checks run successfully; execution metadata may be incomplete (preview limitation) |
| Intune app protection policy monitoring | ✅ Supported via Graph API | ✅ Snapshots + monitors + drift evaluation confirmed, but execution telemetry is incomplete |
| Teams / Exchange workload monitoring | ✅ Achievable via Graph with correct permissions | ⚠️ Not validated in this test set; behaviour still workload‑dependent |
| Per‑device compliance state monitoring | ✅ Supported (device‑centric Graph APIs) | ❌ Out of scope by design – UTCM monitors tenant configuration, not device state |
| Multi‑tenant / cross‑tenant monitoring | ❌ Complex and requires orchestration | ⚠️ Technically possible, but depends on delegated auth and correct UTCM SP permissions |
| Automated drift remediation | ✅ Build yourself or use a SaaS tool | ❌ Not available – detection only in preview |
| Maintenance overhead | ❌ High as you own scripts, schema changes, API drift | ✅ Low operational overhead, but higher diagnostic effort during preview |
| Operational confidence today | ✅ High — behaviour deterministic | ⚠️ Medium – results are correct, but diagnostics and metadata are unreliable with some resource types |
| When to use today | ✅ Best for full Intune + device‑level control | ✅ Viable now for CA and Intune, if you accept preview limitations |
My Practical Recommendation
Deploy both. They are complementary, not competing.
- You can run Scripts 1–6 with CA enabled today. CA drift detection is working, valuable, and has a low maintenance burden. A changed or deleted CA policy is one of the most impactful security events in a tenant and having a 6-hour detection cycle for it is worth the 30-minute setup.
- Definitely keep Part 1 tooling for Intune. Until all Intune monitors are proven and working as needed via UTCM, the Graph API approach from Part 1 is the only reliable route for Intune drift detection. Do not remove that coverage waiting for UTCM Intune monitoring to be ready and GA.
- Test Intune resource types monthly across the full UTCM stack to verify and changes.
- Share your results. If you get different findings in your tenant, especially if Intune monitor creation succeeds and please share in the comments. UTCM is still a in staged rollout, which means backend availability varies. Your results add to the collective picture.
My Closing Thoughts
During my extensive testing the focus was around CA and Intune. UTCM is genuinely useful today for Conditional Access monitoring and my testing was consistent throughout. What this means is there are other M365 resource types un-tested for which this blog hasn’t covered.
For Intune, the picture is mixed. All sixteen tested resource types now generate successful snapshots following early results. This showed meaningful progress from the early preview state. After taking a few wrong configuration paths and understanding some minor limitations, scripting proved successful and Monitors ran along with associated drifts.
The most important thing I can say from this testing is: verify everything in your own tenant. UTCM is in staged preview with varying backend availability. My two-tenant results gave a consistent picture, but your tenant may be in a different preview ring. The tools to probe and verify are all published on GitHub and can help. PLEASE run them, share your results, and help the community build the complete picture.
Technical References
UTCM API overview: learn.microsoft.com/en-us/graph/unified-tenant-configuration-management-concept-overview
UTCM Intune resource catalog: learn.microsoft.com/en-us/graph/utcm-intune-resources
UTCM Entra resource catalog: learn.microsoft.com/en-us/graph/utcm-entra-resources
UTCM authentication setup: learn.microsoft.com/en-us/graph/utcm-authentication-setup
Entra Tenant Governance configuration management: learn.microsoft.com/en-us/entra/id-governance/tenant-governance/configuration-management
TenantBaseline (Ugur Koc): github.com/ugurkocde/TenantBaseline
UTCM introduction (Tony Redmond, Office 365 for IT Pros, Feb 2026): office365itpros.com/2026/02/03/utcm-beta/
Scripts used in this post: https://github.com/Croxleyboy/IntuneScripts
| ← Part 1: DIY Drift Management : Open Part 1 |